Injection Molding Tooling Amortization and Break-Even Volume Calculation
Understand when tooling cost or piece price drives your total program cost.
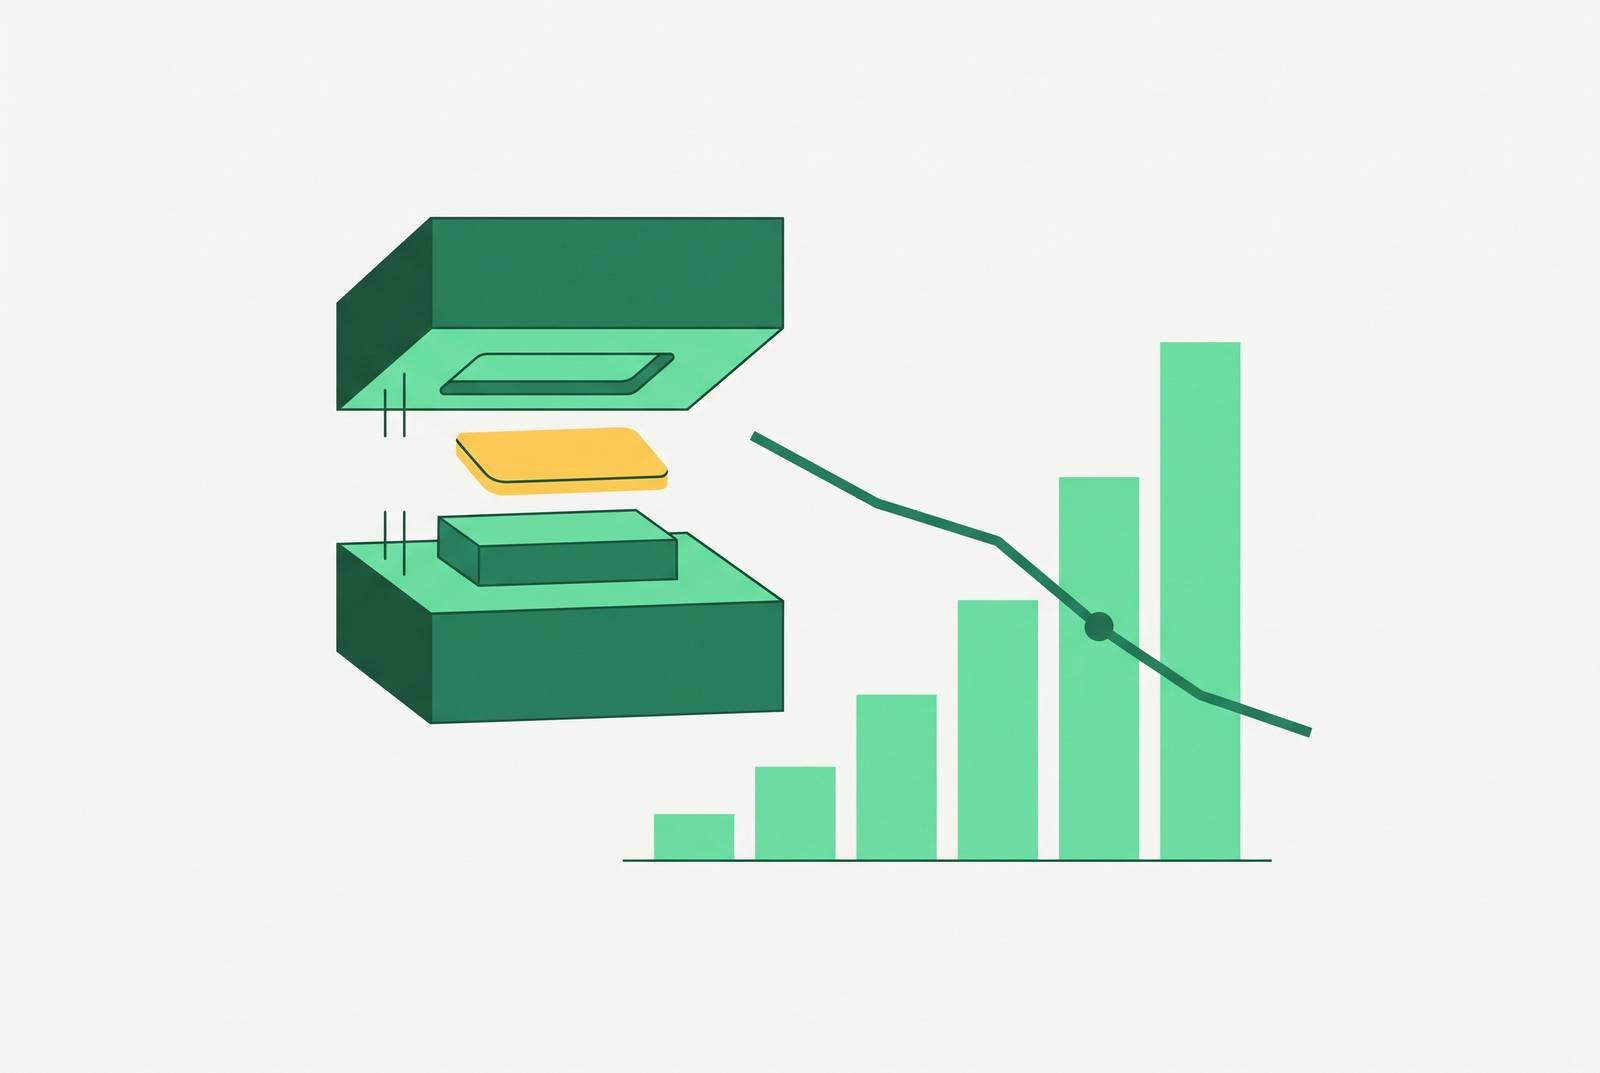
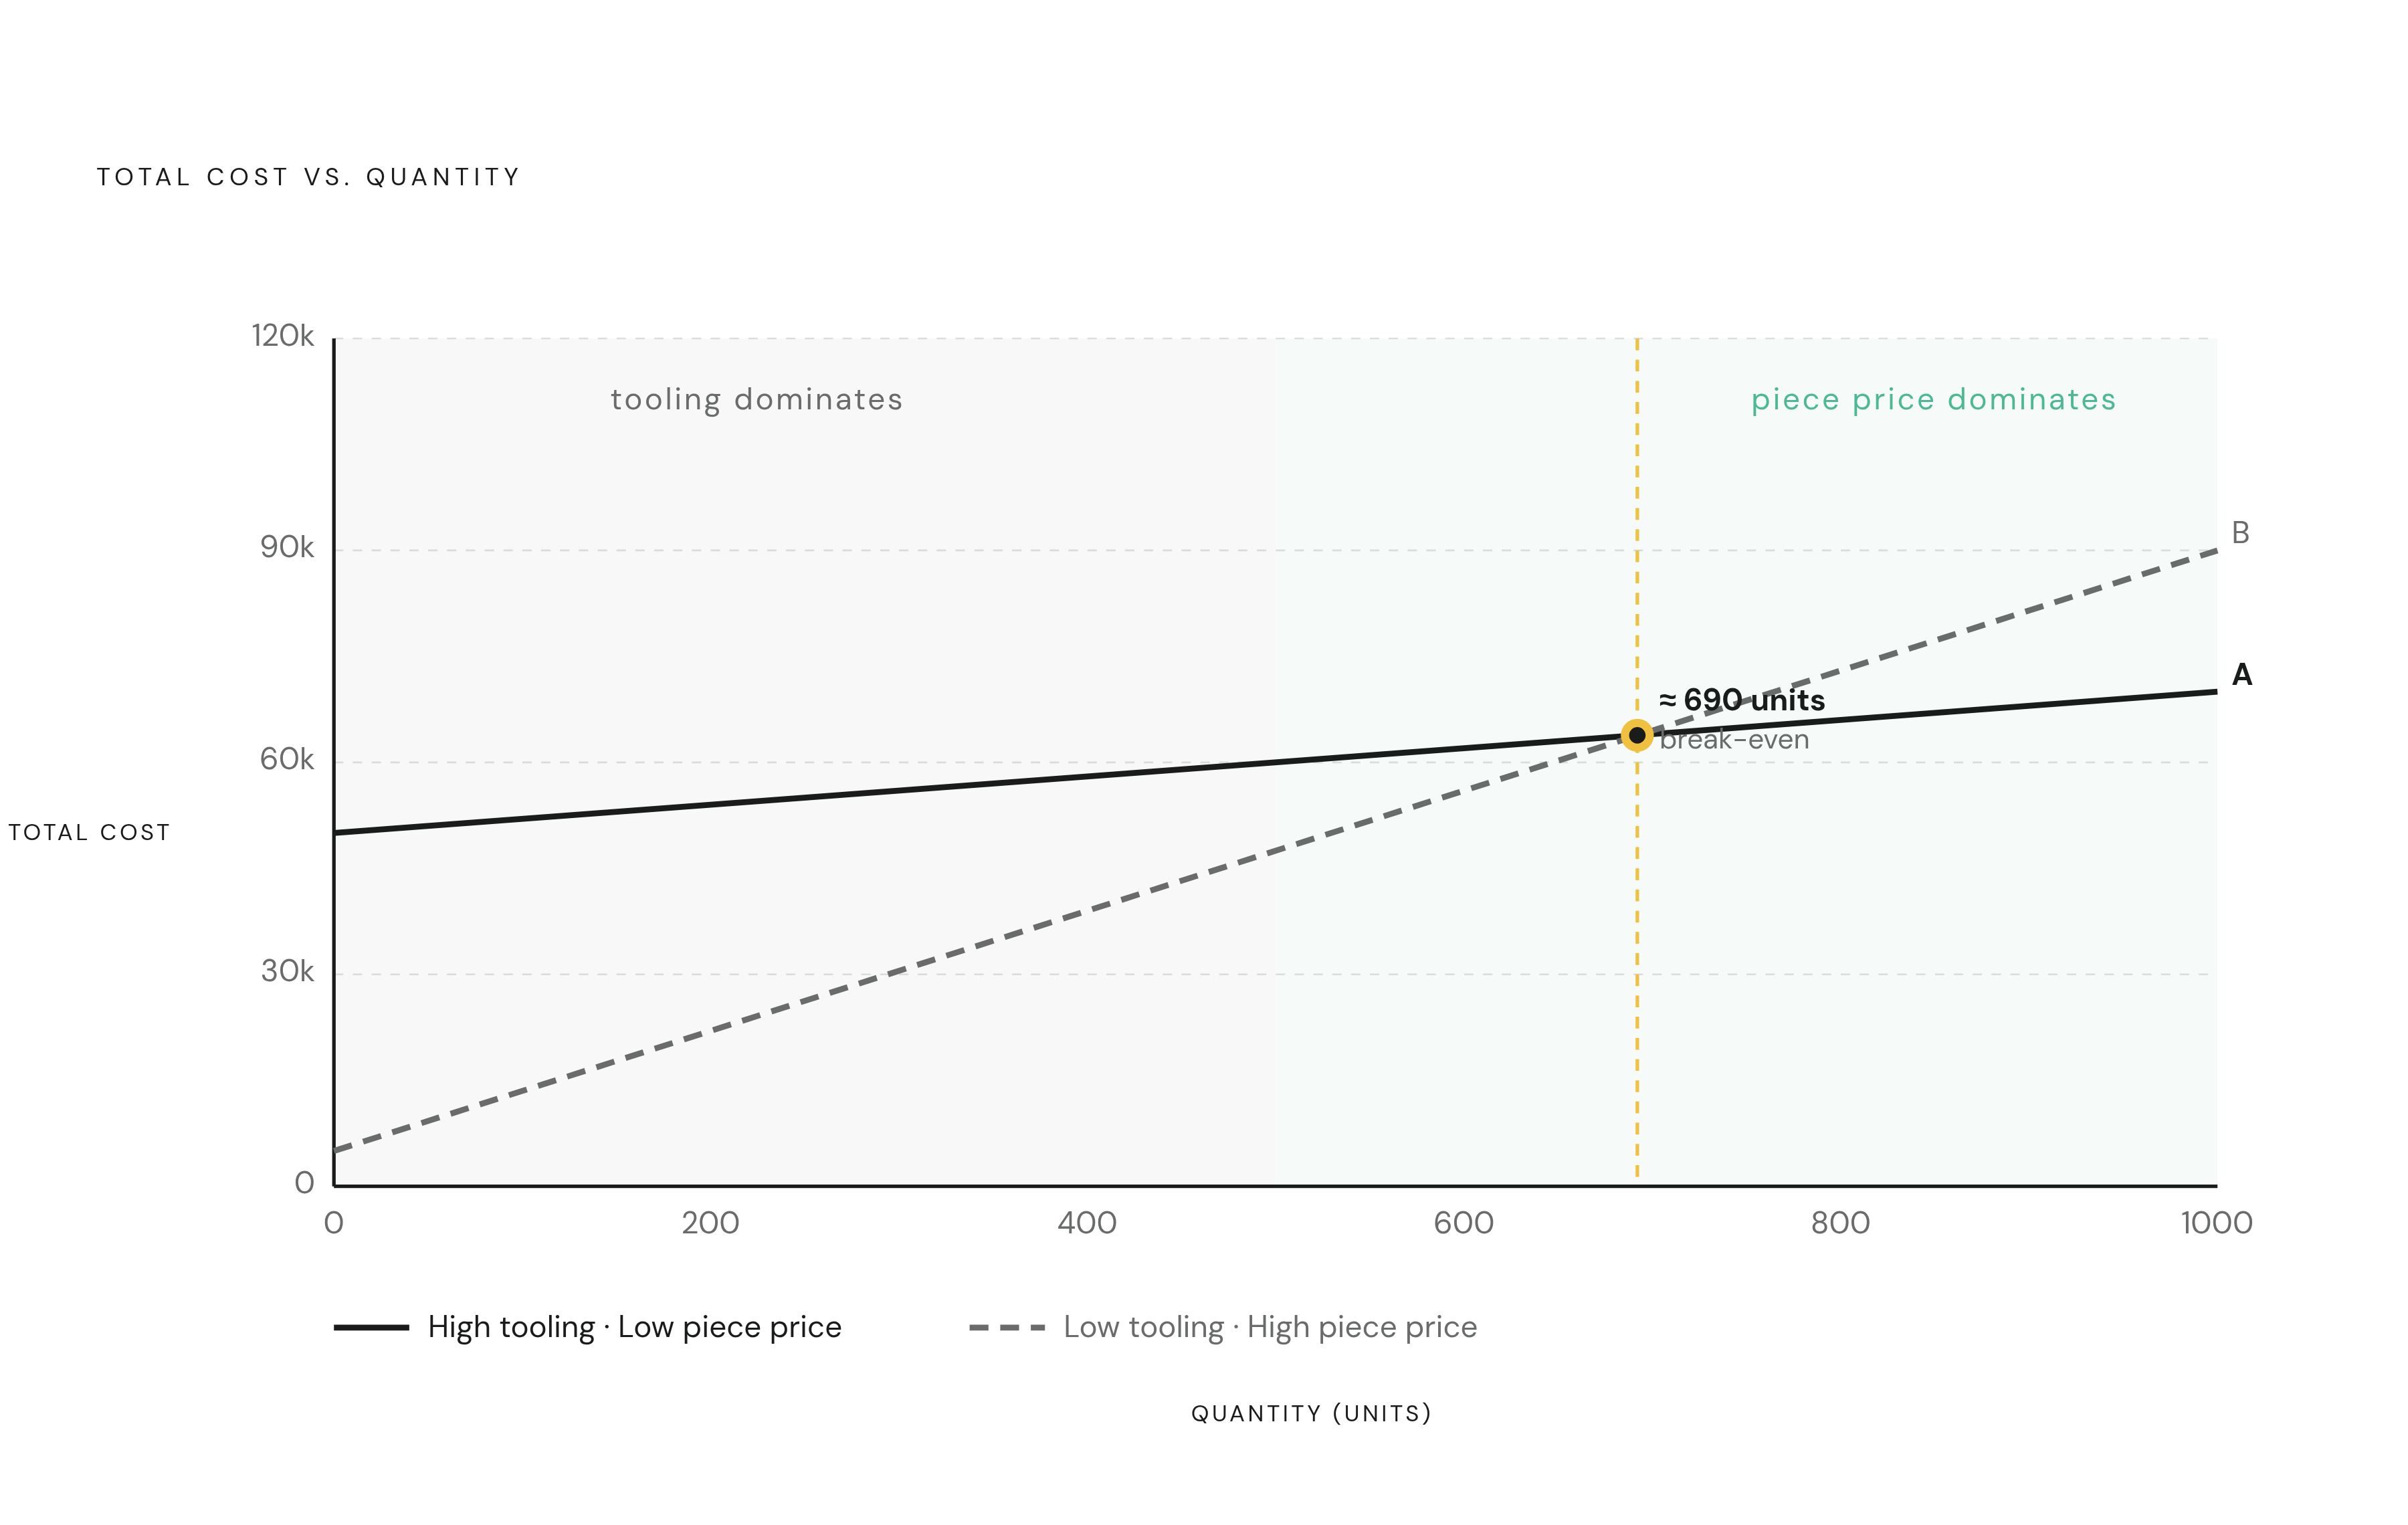
Injection molding spending comes in two forms that behave nothing alike, and the single biggest mistake an engineer can make is treating them as one number. The full formula for a program's total cost is tooling cost plus piece price multiplied by quantity. Tooling is paid once, up front, no matter how many parts ever come off the line. It covers mold design, design-for-manufacturing review, cavity machining, any side actions the part geometry demands, and tryout. Piece price is the opposite: it's paid again on every single part, forever, for as long as the program runs.
This split is the reason a quote that looks cheap on paper can be the expensive choice, and a quote that looks expensive can be the bargain, and it is not merely an accounting detail. A tool with a substantial fixed cost against a modest piece price behaves completely differently at low quantities than it does at high quantities. At low volume, that fixed cost gets divided across a small number of parts, so it dominates the total and the piece price barely matters. As volume climbs, the tooling cost spreads thinner and thinner, and the piece price starts to drive the number instead. Somewhere in between, the two forces trade places as the thing to watch.
That means a quote can't be judged on unit price alone, especially at the volumes most new programs actually run at. Two suppliers can offer the same piece price and still produce wildly different total program costs if their tooling quotes differ. The only way to compare them honestly is to run both terms of the formula side by side, for the actual quantity the program expects to produce. Everything in the rest of this model, every line item that follows, exists to feed one of these two terms: the fixed cost paid once, or the recurring cost paid per part. Get that split straight first, and the rest of the math becomes a matter of filling in numbers an engineer can actually obtain.
The complete cost model an engineer should build before requesting a tooling quote
A workable cost model needs six separate input lines, and leaving even one out produces a break-even number that will steer a go/no-go decision in the wrong direction. Take a simple plastic housing as a working example and walk through each line the way an engineer would before ever picking up the phone to request a quote.
Material cost per part starts with resin price per unit weight, multiplied by the shot weight the part actually consumes, including any runner waste that doesn't end up in the finished piece. A scrap factor gets layered on top of that, because not every shot comes out usable. For a plastic housing like this, this is often the single largest cost line once the program reaches real production volume, bigger than labor, bigger than machine time.
Machine cost per part comes from cycle time in seconds divided by seconds in an hour, multiplied by the press's hourly rate, then divided by the number of cavities in the tool. Press rates shift depending on tonnage and region, so this line needs a real number from a real quote, not a guess. Cavity count sits in the denominator here: more cavities spread the machine cost across more parts per cycle and push this number down directly.
Labor and overhead cover setup time amortized across the lot size, the operator's time running the job, quality inspection, and packaging. How much automation the line has changes this number more than almost anything else on the sheet. A fully automated cycle, where parts drop and get boxed without a hand touching them, keeps this line small. A process that needs someone manually trimming flash off every part or placing metal inserts into the mold by hand pushes it up fast.
Scrap rate adjustment makes sure the denominator used for tooling amortization is the accepted quantity, not the gross number of parts molded. Some of what comes off the press gets rejected at inspection, and those rejects still cost material and machine time without producing a sellable part. Applying a realistic scrap buffer to the material and machine cost lines keeps the final per-part figure honest.
Secondary operations and logistics round out the sixth line: trimming, surface finishing, any inspection documentation a customer requires, and freight to get the parts where they need to go. These costs get underweighted constantly in early estimates, and they can move the landed cost of a part by a meaningful margin once they're added up across a full production run. Every one of these six lines can be filled in with numbers pulled from real quotes and real resin pricing sheets. That makes the model a planning tool.
Tooling material and cavity count
Tooling cost looks like one number on a quote, but it's actually the output of two decisions, and both of them also reach forward to change the per-part cost. Mold material is the first decision, and it sets how many shots the tool can produce before it wears out, which in turn sets the ceiling on how far the fixed cost can be spread.
P20 steel is the baseline choice, priced lowest among the common steel grades, good for somewhere between 50,000 and 300,000 shots, and well suited to medium-volume runs in general-purpose plastics. H13 costs 25 to 40 percent more than P20 but survives for 300,000 to 800,000 shots, which makes it the right call for high-volume programs or resins that chew through tooling, like glass-filled materials, faster than standard plastics do. S136 is the top of the range, carrying a 60 to 90 percent premium over P20, but it lasts anywhere from 500,000 shots past the million mark, and it holds up against corrosive materials in ways that matter for medical devices and food-contact parts.
Picking the wrong grade in either direction costs money. Specifying S136 for a housing that gets painted and hidden inside another assembly is paying a steep premium for corrosion resistance and surface quality nobody will ever see or need. The reverse mistake, trying to run a high-volume glass-filled resin through a mold built for medium-volume general plastics, wears the tool out early and forces a re-cut long before the program's volume target is reached. Matching the steel grade to the resin and the real production volume is the first lever an engineer has over total program cost, and it's a lever pulled before a single part gets made.
Aluminum tooling complicates this further. Aluminum costs less up front than any steel grade, but its lifespan collapses fast when the resin running through it is glass-filled or otherwise abrasive. In that situation, P20 steel often ends up cheaper over the life of the program despite its higher sticker price, because the aluminum tool needs replacing long before the steel tool would. Where that break-even point sits depends on the specific resin, so it has to be checked against the actual material the part will run in, not assumed from a general rule.
Cavity count is the second decision, and it doesn't scale the way intuition suggests. A mold's base, its cooling channels, and its ejector system are shared across every cavity inside it, so a 4-cavity tool costs nowhere near four times what a single-cavity tool costs. That shared infrastructure is what makes multicavity tooling attractive at volume. But the premium a multicavity tool adds over a single-cavity version only pays for itself if the program produces enough parts to recover it through the per-part savings those extra cavities generate. Below that volume, the extra cavities are dead weight on the quote, a cost paid for capacity the program never uses.
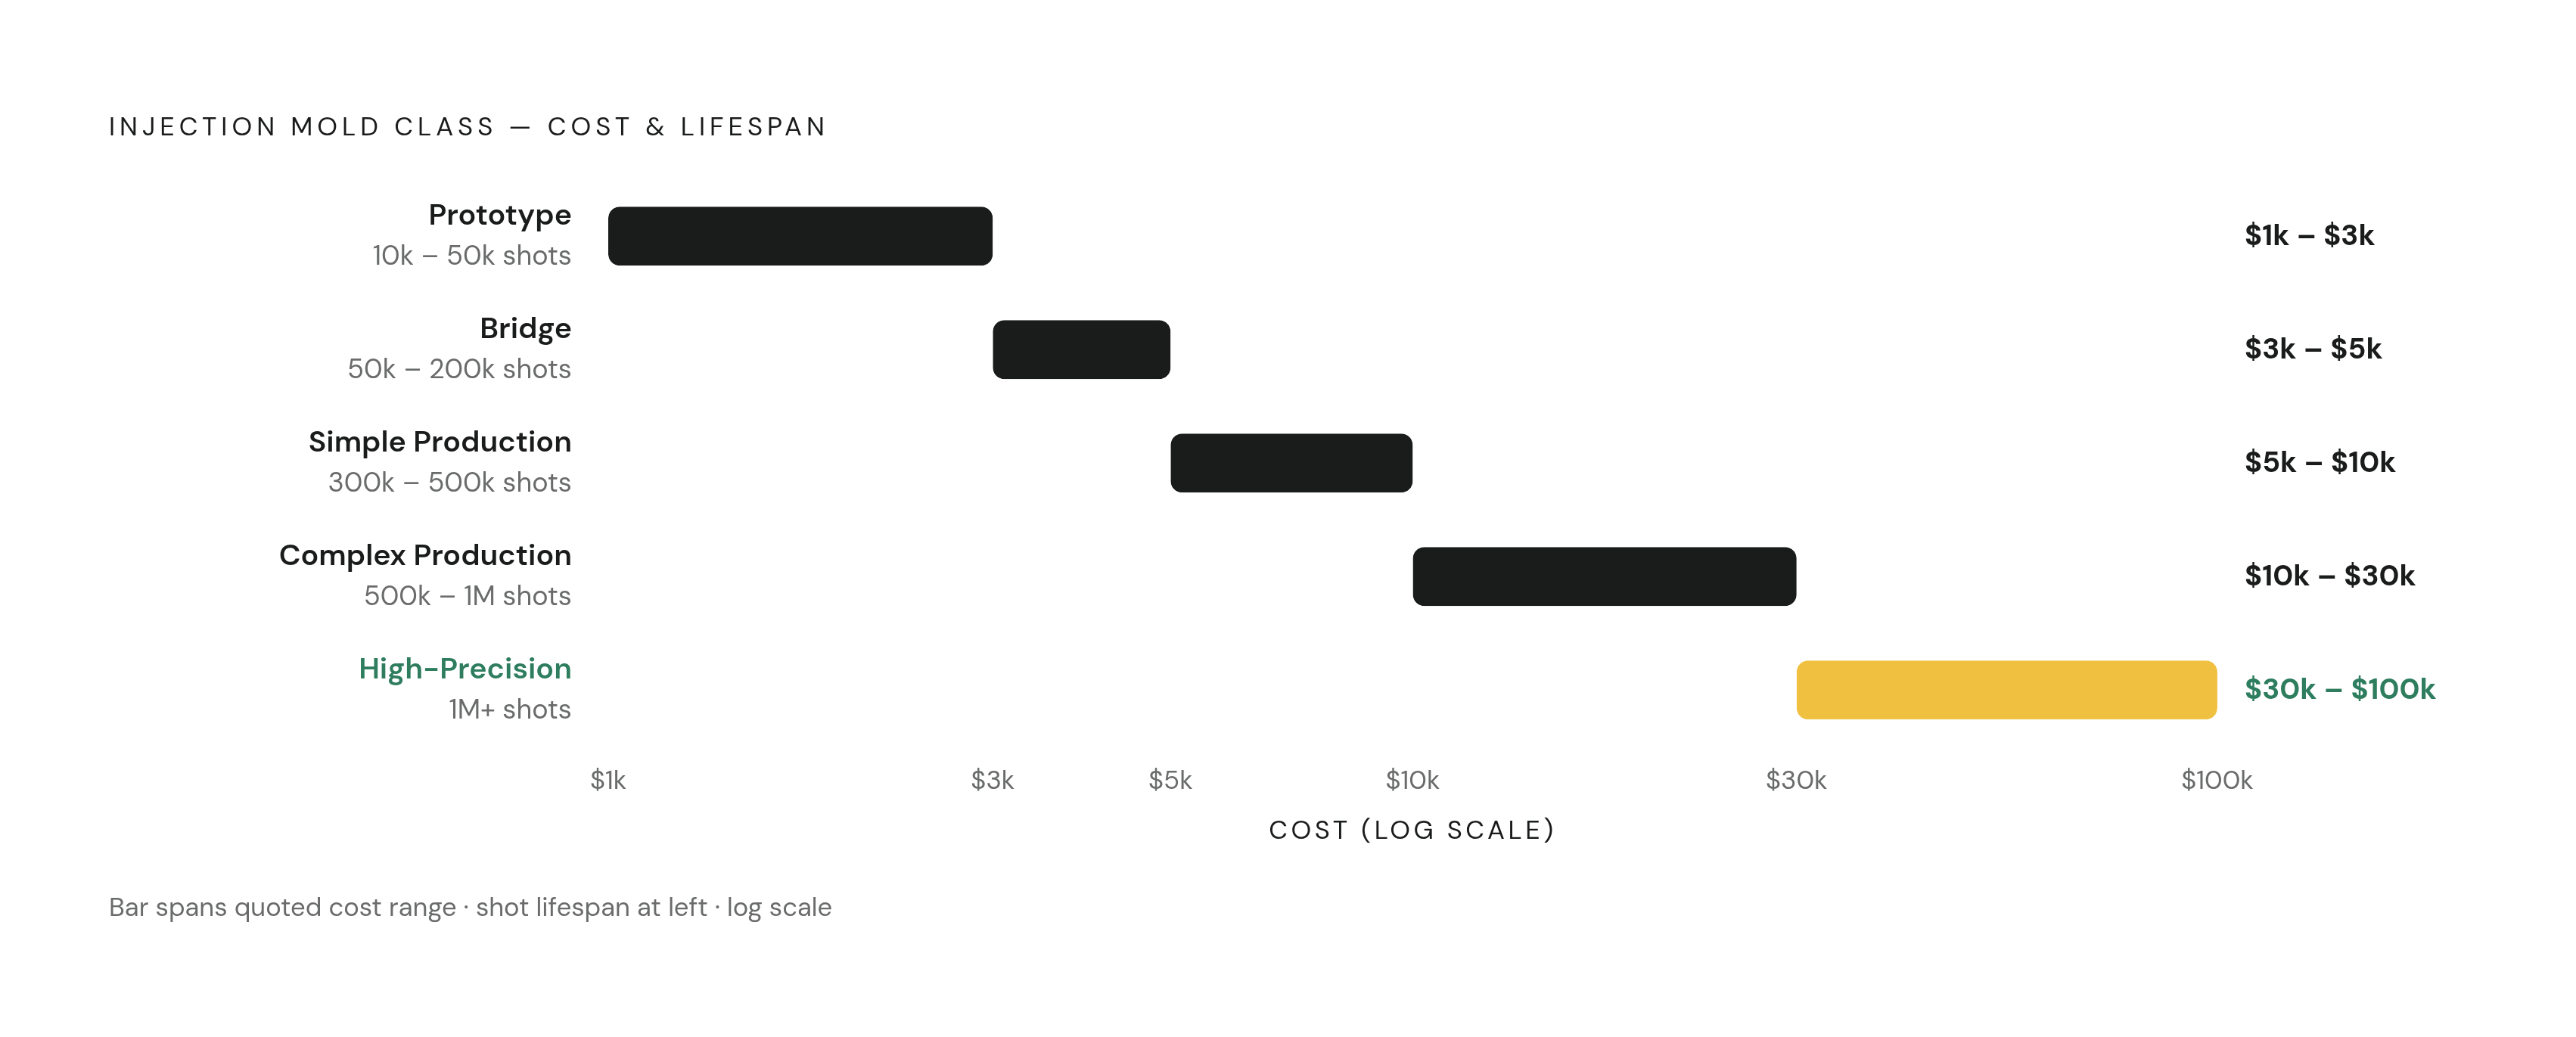
These two decisions, steel grade and cavity count, compound. A program that picks the wrong steel grade for its resin and the wrong cavity count for its volume ends up with a tooling cost that no reasonable production run can amortize efficiently. Mapping real quotes against mold class gives a sense of where these numbers land: a prototype or soft mold with one cavity in P20 or aluminum runs $1,000 to $3,000 and lasts 10,000 to 50,000 shots. A bridge mold with one or two cavities in P20 runs $3,000 to $5,000 for 50,000 to 200,000 shots. A simple production mold with two to four cavities in P20 or H13 runs $5,000 to $10,000 for 300,000 to 500,000 shots. A complex production mold with four to eight cavities in H13 or S136 runs $10,000 to $30,000 for 500,000 to a million shots. A high-precision or medical mold, with anywhere from one to sixteen cavities in S136 or NAK80, runs $30,000 to $100,000 and lasts past a million shots. Every one of these ranges is an input to the break-even formula, not a fixed fact about what tooling has to cost.
The break-even formula and its use against an alternative process
Break-even volume answers one specific question: how many parts does a program need to produce before injection molding costs less, in total, than whatever alternative process is also on the table. The formula is straightforward. Break-even quantity equals tooling cost divided by the gap between the alternative process's per-part cost and the molded per-part cost.
Below that quantity, the toolless alternative, whether that's CNC machining, 3D printing, or urethane casting, costs less overall, because there's no large fixed cost to recover. Above that quantity, injection molding wins on total program cost, because the tooling investment has spread thin enough that the lower per-part price takes over as the dominant factor. The formula works the same way regardless of which alternative process is being compared against. Only the alternative's per-part cost changes from comparison to comparison; the molded side of the equation stays the same.
Running the math with placeholder numbers drawn from the ranges above makes the mechanics clear. Take an aluminum tool priced near the low end of the prototype range, compared against 3D printing as the alternative. Tooling cost is low and the per-part cost of 3D printing is relatively high, so the gap between the two per-part costs is wide. Dividing a low fixed cost by a wide per-part gap produces a break-even point in the low hundreds of parts; the program only has to clear a few hundred units before molding becomes the cheaper total.
Now take a complex part that needs side actions to form an undercut, quoted as a steel tool in the $10,000 to $30,000 range, compared against CNC machining as the alternative. Tooling cost is much higher here, and CNC per-part pricing tends to sit closer to molded per-part pricing than 3D printing does, so the gap between the two per-part costs is narrower. Dividing a high fixed cost by a narrow gap pushes the break-even point into the low thousands of units. Several thousand parts are needed before the steel tool's investment pays off against the cost of machining each part individually.
Every number that goes into this formula, tooling cost, alternative per-part cost, molded per-part cost, is a figure an engineer can pull from an actual quote. Break-even becomes a procurement tool because it runs on numbers pulled from actual quotes. It belongs in the same spreadsheet as the supplier quotes it's built from, not in a separate planning document disconnected from the numbers on the page. The volume thresholds that come out of worked examples, the low hundreds, the low thousands, are useful as a sanity check on whether a result looks reasonable. They are not a substitute for running the actual formula with the actual quoted numbers for a specific part.
The variables that shift break-even in ways most models miss
A break-even calculation is only as good as what goes into it, and three categories of input get underestimated or left out: how stable the design actually is, how uncertain the demand forecast actually is, and the carrying costs that don't show up on a tooling quote.
Design instability is the most expensive of the three, because it changes the tooling cost after the fact, after the original amortization math has already been built and relied on. If the part design changes once steel has been cut, the program pays again, either for modifications to the existing tool or for a new one entirely, and whatever break-even volume was calculated before that point no longer applies. This happens often when a design gets functionally validated on CNC prototypes but never gets checked against how it actually behaves under real molding conditions like shrinkage, warpage, or fill pattern. Two revision cycles on a steel mold, which is a common outcome in that situation, can add a substantial amount to the total tooling investment and push the timeline back by weeks.
The cost of catching a problem depends entirely on when it gets caught. A problem spotted before design-for-manufacturing sign-off costs very little to fix, often just a design change on a drawing. The same problem, discovered after T1 sampling when steel has already been cut and the first parts have already come off the tool, costs orders of magnitude more to correct. Gate location is a clear example: relocating a gate after T1 typically means welding the old gate shut and re-machining a new one, which runs $1,500 to $4,000 and adds about two weeks of delay. Reviewing gate location before any steel gets cut avoids that cost entirely, and it's one of the easiest checks to run early.
Demand forecast error compounds on top of all of this, and it isn't a rare failure, it's close to the default condition. Most buyers can't pin down their five-year volume to anything tighter than a wide range of possible outcomes. A break-even calculation built on a single expected-value number treats that uncertainty as if it doesn't exist. A more honest model runs the formula across a range of plausible volumes instead of a single guess, so the go/no-go decision accounts for the real chance that actual demand lands well above or well below whatever number sat in the original business case.